Inbreeding & Kinship (part 1)
In the broadest sense, two animals that share an ancestor are considered to be related. The common ancestor can be recent or many generations before the present, there are many possible types of relationship (e.g., half sib, uncle, great-grandfather), and the ancestor can appear not just once but multiple times in the pedigree. Genetic relationships can be complex and difficult to sort out just by looking at a pile of pedigrees. However, there are good tools available that can help you understand the relationships among individuals in a population as well as the structure of the population as a whole.
You have already learned about the coefficient of inbreeding, which expresses the probability of a particular animal inheriting two copies of the same allele from a common ancestor. A related and powerful relationship statistic is called "kinship" (also referred to as "coancestry"). Kinship is similar but refers instead to a pair of animals: specifically, as the probability that one allele that is derived from the same common ancestor is identical by descent in two individuals. Note that kinship is a comparison of the genetic similarity between two animals. Two animals that share many ancestors will share more alleles that are identical by descent, so their genomes will be similar to each other simply as a consequence of their shared ancestry.
The similarities in the definitions of coefficient of inbreeding and kinship are not accidental - the coefficient of inbreeding of an animal is equal to the kinship coefficient of its parents. So a pair of animals with a high kinship coefficient are genetically more similar than another pair with a low kinship coefficient. Like COI, kinship coefficients run from 0 to 1 (0 to 100%).
What does the kinship coefficient tell us?
If kinship is so similar to COI, why do we need it? The coefficient of inbreeding is a number that is specific to a particular individual. Kinship, on the other hand, specifically refers to genetic relationship or similarity between two individuals, or between one animal and a group of animals. So for example, if you had a table of the kinship values for every possible male-female pair in a population of animals, the pairs with the highest values would be most closely related (and therefore likely to be genetically most similar) and the pairs with the lowest would be least related. If you wanted to reduce the risk of genetic diseases caused by recessive mutations in a litter of puppies, you would choose among the potential mates with the low kinship coefficients. In actuality, this is the same information you would get it if you did all possible pairwise test matings and determining the coefficient of inbreeding of the puppies that would result. But kinship can also be used to reveal important information about the genetic structure of a population and the "genetic value" of particular individuals to the breed as a whole.
Let's say you generated a table of all possible pairwise kinships of the current reproductive population of your breed and that you also had the COI for all of these animals. You could then examine the frequency histograms of these two sets of data:
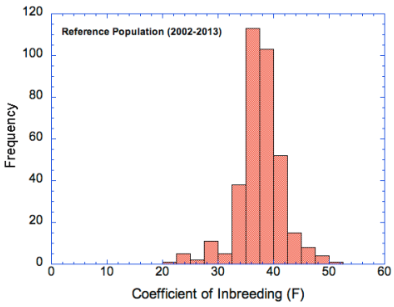
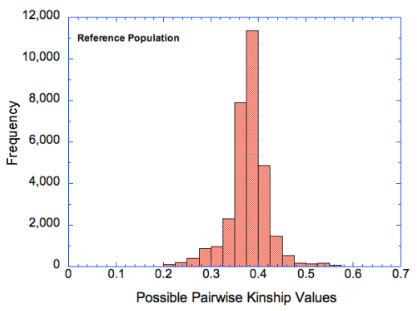
* Note the difference in the axes - the coefficient of inbreeding data are as percent (0-60%) and the kinship data as a fraction of 1 (0-0.7), so 40% on the COI graph is the same as 0.4 on the kinship graph.
For this breed, the COI graph (left) indicates that the most of the population has COI greater than about 35%, with some as high as 50%. The graph of pairwise kinship values (on the right) is very similar, but notice that the numbers on the y-axis are much higher because the COI graph depicts the actual coefficients of individuals in the population, whereas the histogram of kinship values depicts all possible pairwise combinations (including with itself).
If these graphs were different, that would indicate that there was a bias towards producing animals with higher (or lower) COI than their statistical representation in the population. If breeders were to preferentially select breeding pairs that fell in the left tail of the kinship graph, the result would be lower COI in the offspring and a shift in both graphs to the left. (This would be a good thing.) The fact that there is a lower tail on the kinship graph means that it is possible for breeders to reduce the overall level of inbreeding in the population (at least a bit) by choosing pairs with lower kinship.
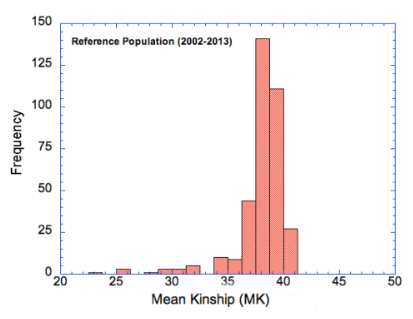
Now look at this third graph. Let's say we have animal A in a population of animals. We can compute all the pairwise combinations of kinship between A and animals of the opposite gender - e.g., A to B, A to C, A to D, etc (like we did above). The average of all of those kinships involving A and another individual is the mean kinship for animal A. We could then do the same for animal B, and for C, etc and have a list of "mean kinship" values for the animals in the population.
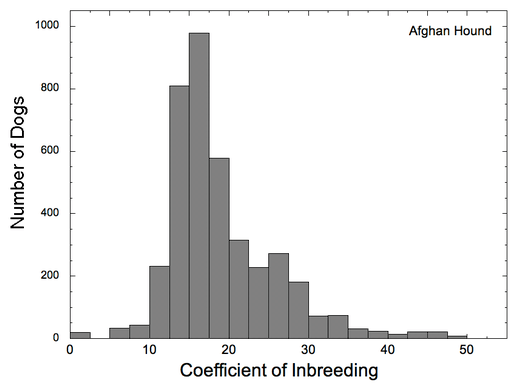
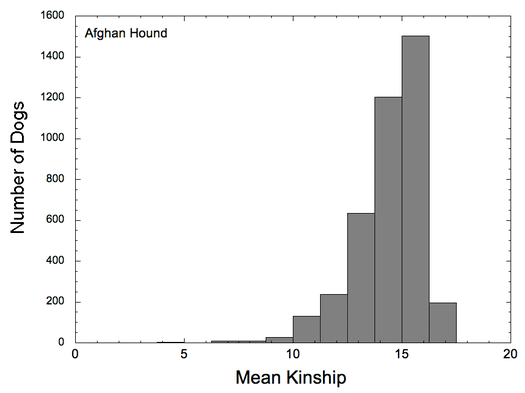
Let's look at another example. Note first that the scales on these two graphs are different (0-60% for COI, 0-20% for kinship). In this case, you can see that there are many dogs in the population with COI > 20% (and a few greater than 40%!), even though the distribution of mean kinship peaks at about 15% and drops off steeply after that. This indicates that breeders are deliberately choosing to very closely inbreed, producing offspring that are far more genetically similar than full siblings (which would have COI of 25%).
Identifying "genetically valuable" animals
If you think about it, you will see that animals with lots of close relatives in the population will have a higher "mean kinship" than animals with very few relatives. There will be many more copies of the genes of the former than the latter, because all of these animals will be genetically similar. On the other hand, an animal with a low mean kinship will be genetically less similar to most of the population. From the perspective of genetic "resources" (or genetic diversity), animals with low mean kinship are genetically more valuable because their genes are relatively rare in the population. Losing a few of the individuals with high mean kinship won't affect the overall genetic composition of the breed much; losing a few animals with low kinship risks losing genes that are relatively rare.
So, in the first set of graphs above, the one for Mean Kinship has high frequencies in the 35-40 range, but there are also some in a rather long tail to the left. These data are for a breed that did an outcross to another breed, and the descendants of that outcross stand out as having much lower average kinship than the animals in the main population. Relative to the population as a whole, those animals carry the greatest proportion of unique alleles, and by the definition we used earlier these animals would be considered to be "genetically most valuable". If preserving those rare alleles was a priority, then these animals would indeed be most valuable. In practice, there would probably be other considerations (e.g., aspects of type), but these could be weighed together with the genetic information.