Genetic analysis of populations (part 2)
3) For much of its history as a registered breed the total population was small (less than ~500 dogs until about 1990);
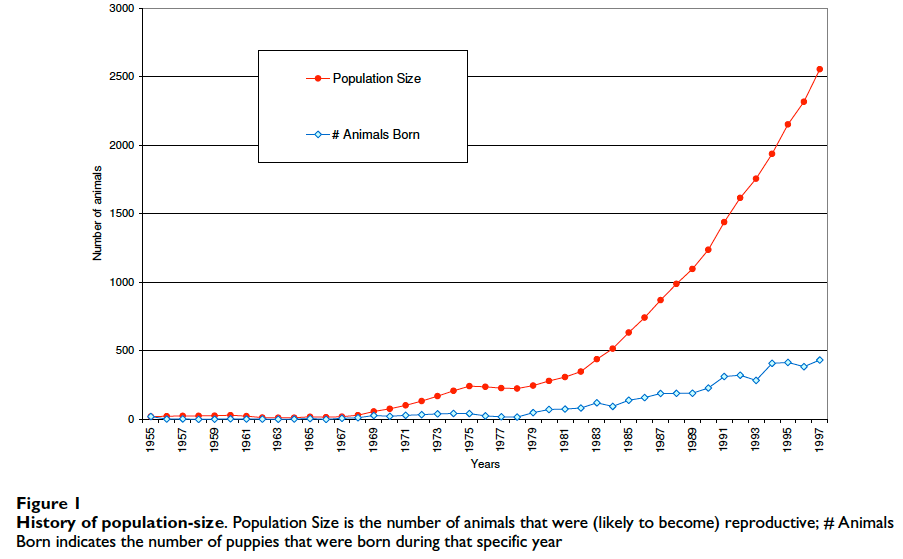
4) There has been a rapid increase in registrations in recent years as the breed has gained a following and been introduced to new countries (see Figure 1);
5) At the time of the study, the current population numbered about 2500 dogs, many times the size of the founding population.
Knowing that breeding of Icelandic Sheepdogs had not been managed in any way as the breed grew in popularity, Oliehoek and his colleagues suspected that an analysis of the breed might reveal some evidence of significant inbreeding.They gathered together the pedigrees for all the registered dogs in the world back to founders (a total of 4680 current and ancestor dogs) and subjected them to special analyses that were able to reveal things about the breed that would have been difficult or impossible to learn any other way.
They found that not only were the dogs extremely inbred, but the situation of the breed was dire.
In just the first 10 years after registration, the breed lost more than 50% of its initial genetic diversity (Figure 2). In this graph, the breed starts with the genetic equivalent of 20 founders. The green line with crosshatch is the average MK (mean kinship), an index of genetic diversity, and you can see that it falls dramatically in the first decade (1950s) and continues to decline in the second (1960s). It levels off in the early 1970s at a level of about 2.2 (expressed as “founder genome equivalents”, which we defined in our discussion of Tollers and Heelers). In essence, the breed had been reduced in just 20 years to a population of animals with the genetic diversity of less than three dogs.
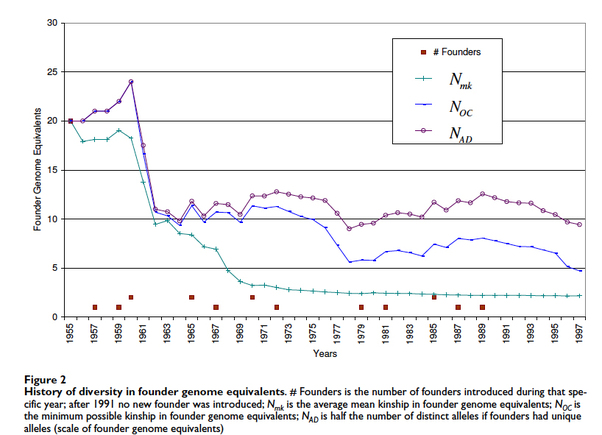
The astonishing decline in genetic diversity was a consequence of breeding practices that resulted in increasing levels of inbreeding (i.e., homozygosity) and kinship (relatedness of dogs to each other). When you see these two lines cross in this graph (below), it means that breeders where selectively breeding animals that were more closely related than average, which drives up the level of inbreeding faster than kinship. The average coefficient of inbreeding of 25% is equivalent to that produced by sib-sib matings.
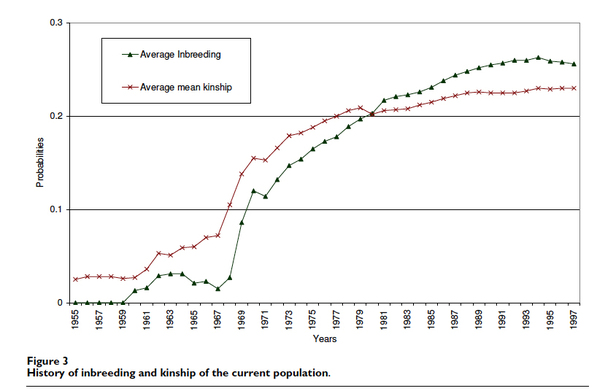
In essence, the entire breed population had the genetic diversity you would expect to find in less than 3 dogs that are as closely related as full siblings.
To save the breed from potential extinction as a consequence of inbreeding, the genetic diversity in the population(s) of breeding dogs needed to increase. How could they do this?
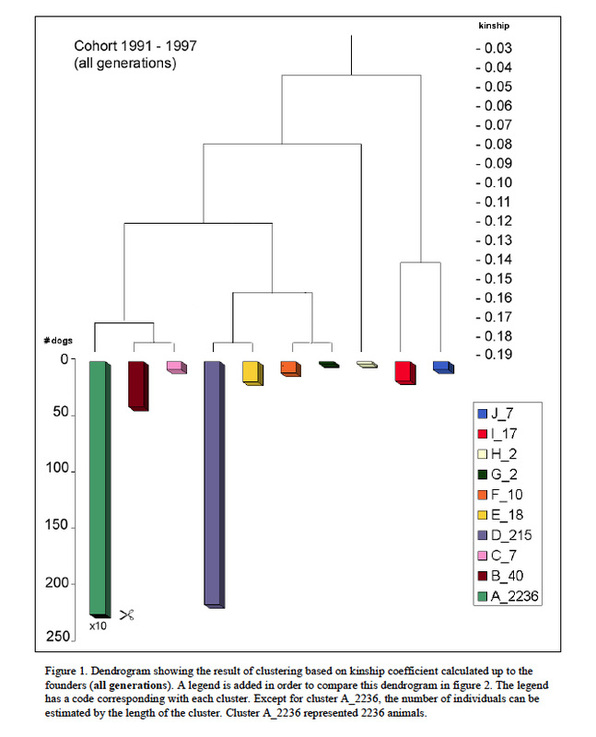
Using an analytical technique called “cluster analysis”, Oliehoek sorted the existing dogs into groups of individuals that were similar genetically. He was able to identify 8 groups: two large ones (green and purple), four of modest size, and two that were very small. You can see these in Figure 6 (below). Note that the longest bar is really 10 times longer than depicted – so it’s a VERY big group – in fact, 85% of the entire population.
What this means is that the breed population is not genetically homogeneous. That is, there are subpopulations of animals that carry alleles not found in the other groups. This non-random distribution of genetic diversity in a population is called “genetic structure”. It means that breeders could take advantage of this structure to improve the genetic diversity of the subpopulations and also ensure that the small ones do not go extinct.